NGI AutoScaler — Sanity-Check Figures
Full Autoscaling Pipeline for VIPIR NGI Ionograms
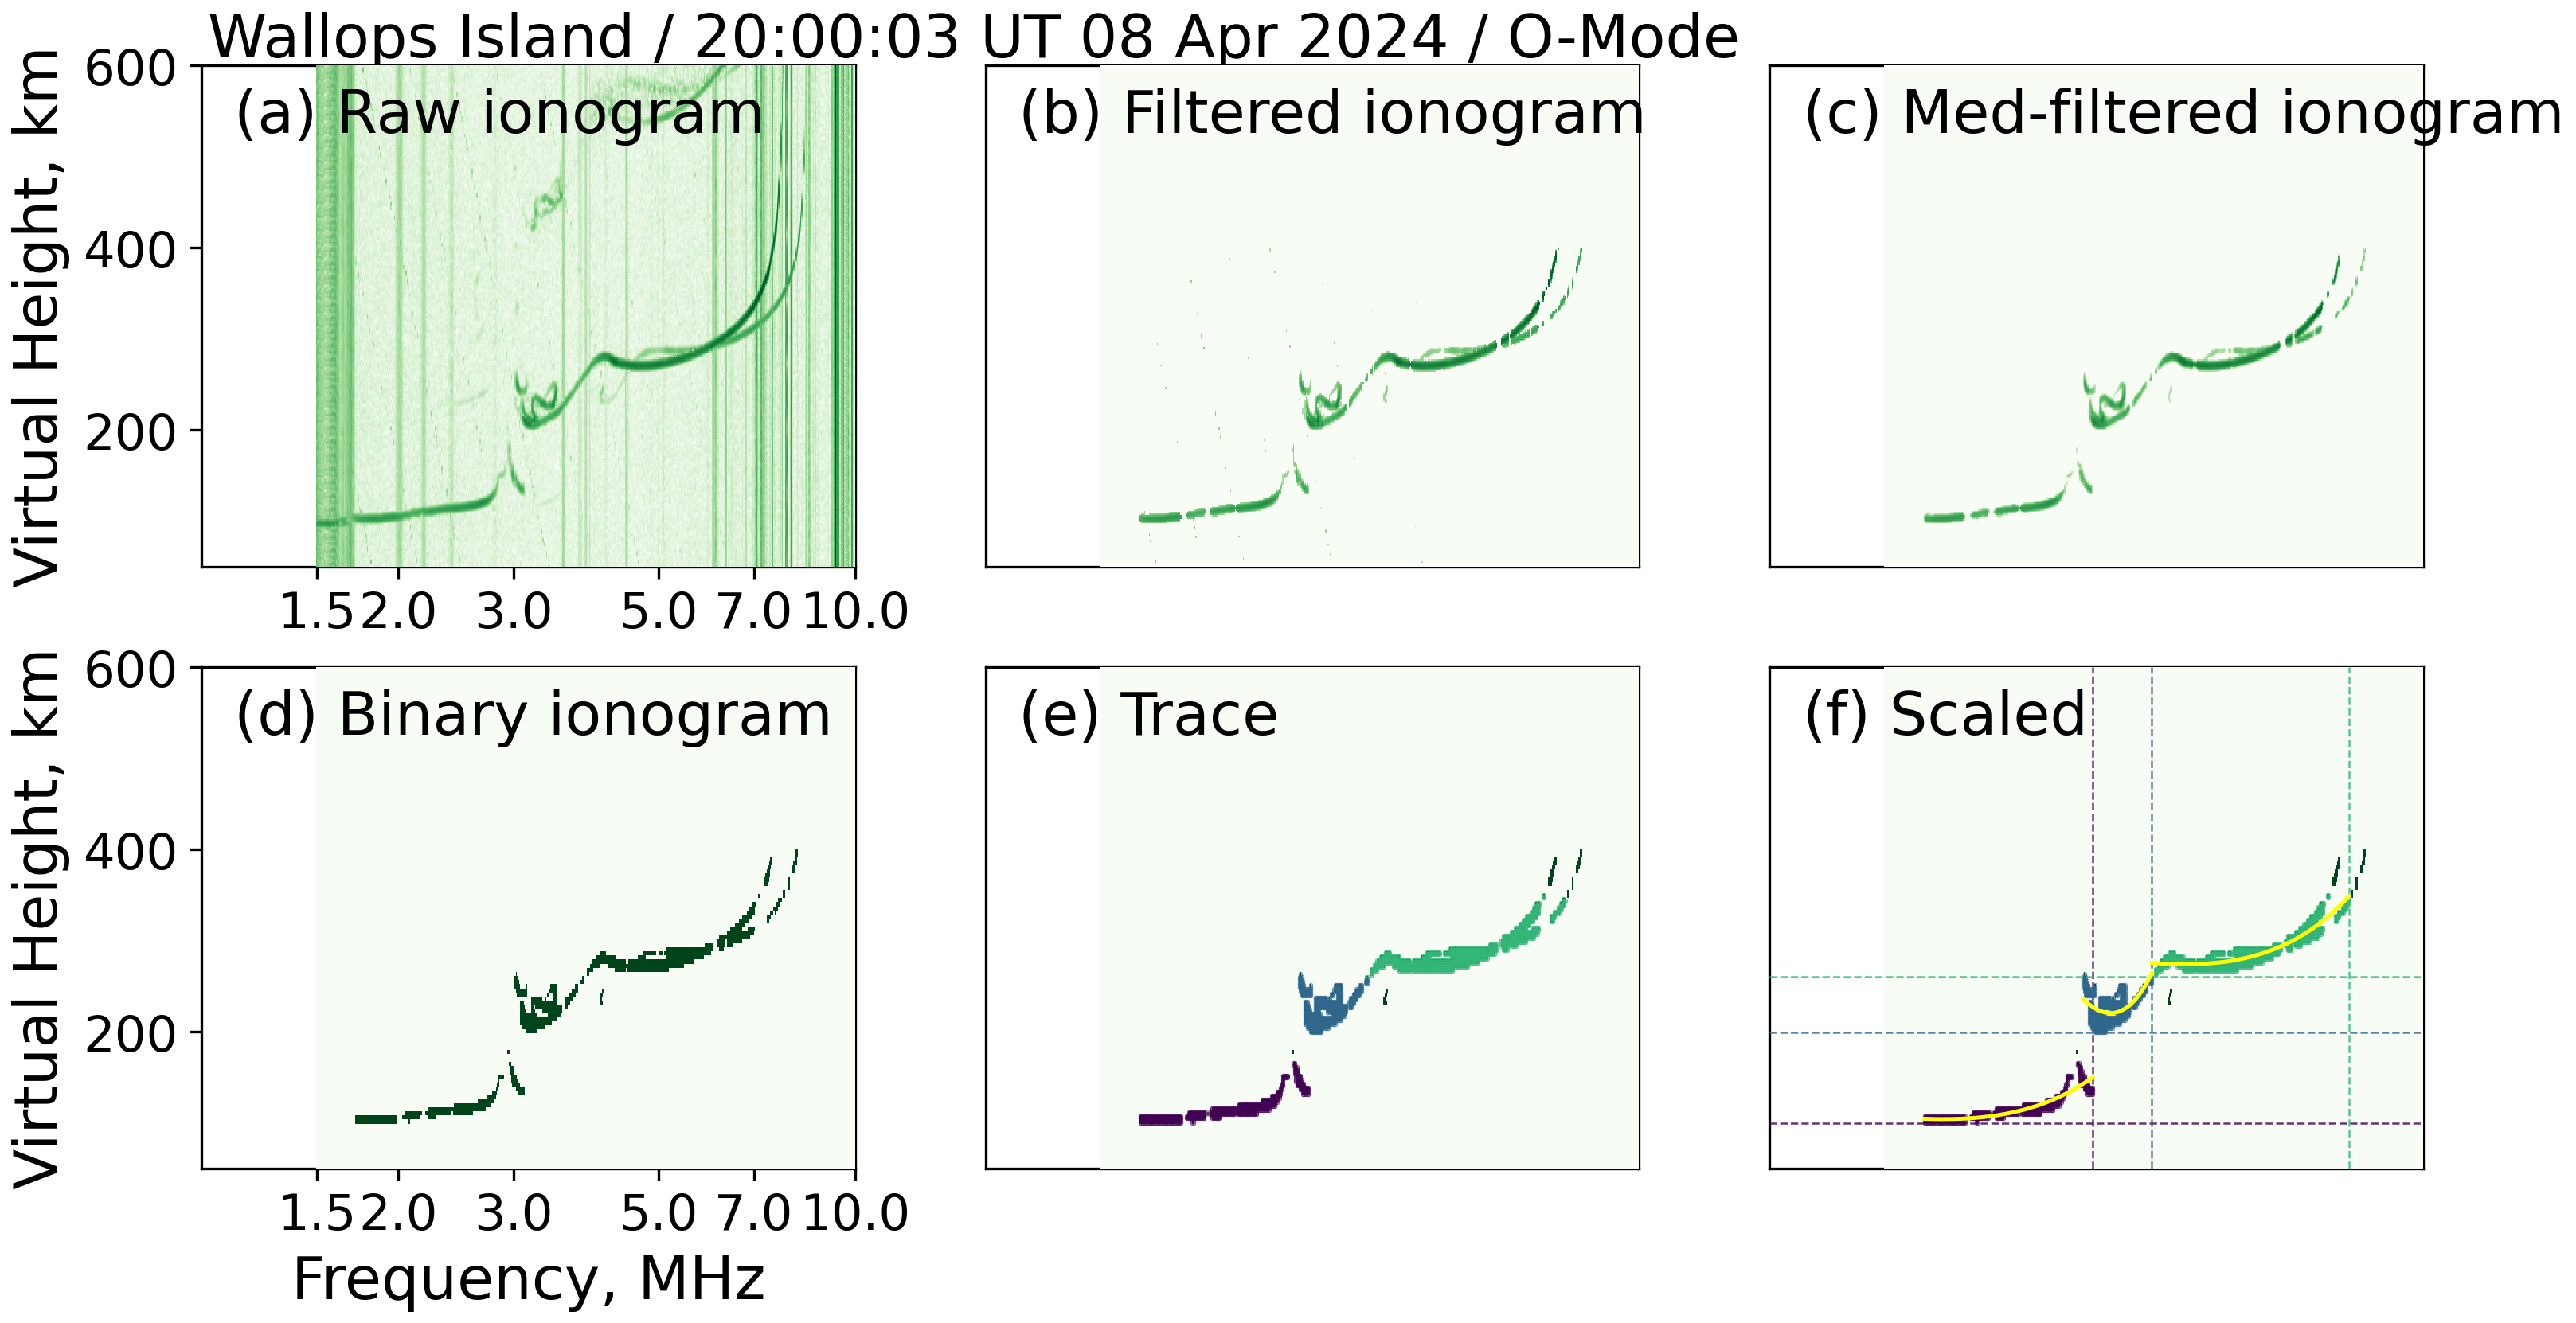
Stage a day of NGI files from an archive, run median filtering, image segmentation, and Otsu + DBSCAN binary-trace extraction, then emit a QA sanity-check figure for visual validation.
This page explains examples/vipir/scale_module.py.
Data used: WI937 (Speed Demon campaign), 8 April 2024 Great American Solar Eclipse (DOY 99).
Why autoscale NGI ionograms?
- Automate trace extraction: Replace manual scaling with a reproducible pipeline that runs the same thresholds and clustering parameters for every sounding.
- QA at every step: The
draw_sanity_check_imagesoutput lets you visually verify that segmentation and binary-trace extraction found the right echoes. - Campaign-scale processing: The helpers are designed to loop over hundreds of ionograms per day; only the TOML configuration file needs updating between campaigns or stations.
Prerequisites
- A VIPIR NGI archive organized as
<root>/<year>/<doy>/ionogram/*.ngi[.bz2]. - A TOML config file readable by
pynasonde.vipir.ngi.utils.load_toml. Key fields:ngi.scaler.noise_constant,ngi.scaler.mode,ngi.scaler.frequency_min/max,ngi.scaler.height_min/max,ngi.scaler.apply_filter,ngi.scaler.segmentation_method,ngi.scaler.otsu.nbins,ngi.scaler.otsu.thresh,ngi.scaler.dbscan.eps,ngi.scaler.dbscan.min_samples. - Set
VIPIR_SPEED_DEMON_ROOTto override the default archive path.
Running the example
export VIPIR_SPEED_DEMON_ROOT=/path/to/your/WI937/individual
cd /home/chakras4/Research/CodeBase/pynasonde
python examples/vipir/scale_module.py
The script stages one day of NGI files into /tmp/vipir_fti/, processes a
single ionogram (indices 1200–1201), writes the QA figure to
docs/examples/figures/ngi.scaler.png, and then removes the temporary staging
directory.
Call Flow
load_toml()reads the campaign TOML configuration.stage_day(root, doy, temp_root)copies<root>/2024/0<doy>/ionogram/into/tmp/vipir_fti/<doy>/ionogram/.DataSource(source_folder=...).load_data_sets(1200, 1201, n_jobs=20)loads the NGI cube for the selected ionogram index range.AutoScaler(dataset, noise_profile=NoiseProfile(constant=...), ...)creates the scaler configured with campaign thresholds..mdeian_filter()suppresses short-range noise..image_segmentation()detects echo features..to_binary_traces(nbins, thresh, eps, min_samples)applies Otsu thresholding followed by DBSCAN clustering to extract binary trace points..draw_sanity_check_images(SANITY_FIGURE, ...)renders a multi-panel QA figure and saves it todocs/examples/figures/ngi.scaler.png.
Key Code
1) Stage Data and Load Datasets
from pathlib import Path
from pynasonde.vipir.ngi.source import DataSource
from pynasonde.vipir.ngi.utils import load_toml
import shutil

TEMP_ROOT = Path("/tmp/vipir_fti")
DATA_ROOT = Path("/media/chakras4/Crucial X9/Solar_Eclipse_2024/public/WI937/individual/")
DEFAULT_DOY = 99  # April 8, 2024 eclipse

def stage_day(root, doy, temp_root):
    src = root / "2024" / f"0{doy}" / "ionogram"
    tmp = temp_root / f"{doy}" / "ionogram"
    shutil.rmtree(tmp.parent, ignore_errors=True)
    shutil.copytree(src, tmp)
    return tmp

config = load_toml()
stage_folder = stage_day(DATA_ROOT, DEFAULT_DOY, TEMP_ROOT)

datasource = DataSource(source_folder=str(stage_folder))
datasource.load_data_sets(1200, 1201, n_jobs=20)
2) Build and Run the AutoScaler
from pynasonde.vipir.ngi.scale import AutoScaler, NoiseProfile

cfg = config  # shorthand

for dataset in datasource.datasets:
    scaler = AutoScaler(
        dataset,
        noise_profile=NoiseProfile(constant=cfg.ngi.scaler.noise_constant),
        mode=cfg.ngi.scaler.mode,
        filter={
            "frequency": [cfg.ngi.scaler.frequency_min, cfg.ngi.scaler.frequency_max],
            "height":    [cfg.ngi.scaler.height_min,    cfg.ngi.scaler.height_max],
        },
        apply_filter=cfg.ngi.scaler.apply_filter,
        segmentation_method=cfg.ngi.scaler.segmentation_method,
    )
    scaler.mdeian_filter()          # noise suppression
    scaler.image_segmentation()     # feature detection
    scaler.to_binary_traces(        # Otsu threshold + DBSCAN clustering
        nbins=cfg.ngi.scaler.otsu.nbins,
        thresh=cfg.ngi.scaler.otsu.thresh,
        eps=cfg.ngi.scaler.dbscan.eps,
        min_samples=cfg.ngi.scaler.dbscan.min_samples,
    )
3) Emit the QA Sanity-Check Figure
SANITY_FIGURE = "docs/examples/figures/ngi.scaler.png"

scaler.draw_sanity_check_images(
    SANITY_FIGURE,
    font_size=18,
    ylim=[50, 600],
    xlim=[1, 10],
    xticks=[1.5, 2.0, 3.0, 5.0, 7.0, 10.0],
    figsize=(4, 3),
    txt_color="k",
)
The figure panels show (left to right): raw NGI power, segmented features, and extracted binary traces — providing a visual confirmation that the scaler found ionospheric echoes in the correct frequency and height window.
Output Figure
Related Files
examples/vipir/scale_module.pypynasonde/vipir/ngi/scale.py—AutoScaler,NoiseProfilepynasonde/vipir/ngi/source.py—DataSourcepynasonde/vipir/ngi/utils.py—load_toml