Full Parameter Analysis — WI937
Filter → Echo Parameters → 3-D Drift Velocity
End-to-end diagnostic workflow: load a WI937 RIQ sounding, apply the
six-stage IonogramFilter, then compute and compare all
Dynasonde parameters (amplitude, EP, PP, V*) and 3-D drift velocity
[Vx, Vy, Vz] between raw and filtered echo clouds.
Script: examples/vipir/ionogram_full_analysis_wi937.py
Pipeline overview
WI937_2022233235902.RIQ
        │
        ▼
  EchoExtractor          →  df_raw  (all echoes)
        │
        ▼
  IonogramFilter         →  df_filt (noise-rejected echoes)
  (stages 1–5, temporal skipped)
        │
        ├──► fit_drift_from_df(df_raw)   →  df_vel_raw
        └──► fit_drift_from_df(df_filt)  →  df_vel_filt
                                                │
                                                ▼
                                     3×3 diagnostic figure
Steps
1 — Load and extract echoes
from pynasonde.vipir.riq.echo import EchoExtractor
from pynasonde.vipir.riq.parsers.read_riq import VIPIR_VERSION_MAP, RiqDataset

riq = RiqDataset.create_from_file(
    "examples/data/WI937_2022233235902.RIQ",
    unicode="latin-1",
    vipir_config=VIPIR_VERSION_MAP.configs[1],  # vipir_version=0 / data_type=1
)

extractor = EchoExtractor(
    sct=riq.sct, pulsets=riq.pulsets,
    snr_threshold_db=3.0,
    min_height_km=60.0,
    max_height_km=1000.0,
    min_rx_for_direction=3,
    max_echoes_per_pulset=5,
)
extractor.extract()
df_raw = extractor.to_dataframe()
2 — Filter (stages 1–5)
from pynasonde.vipir.riq.parsers.filter import IonogramFilter

filt = IonogramFilter(
    rfi_enabled=True,       rfi_height_iqr_km=300.0,  rfi_min_echoes=3,
    ep_filter_enabled=True, ep_max_deg=90.0,
    multihop_enabled=True,  multihop_orders=(2, 3),
    multihop_height_tol_km=50.0, multihop_snr_margin_db=6.0,
    dbscan_enabled=True,    dbscan_eps=1.0, dbscan_min_samples=5,
    dbscan_features=(
        "frequency_khz", "height_km",
        "velocity_mps", "amplitude_db", "residual_deg",
    ),
    ransac_enabled=True,    ransac_residual_km=100.0,
    ransac_min_samples=10,  ransac_n_iter=200,
    ransac_poly_degree=3,   ransac_min_inlier_fraction=0.3,
    temporal_enabled=False,
)

df_filt = filt.filter(extractor)
print(filt.summary())
3 — Height-binned drift velocity (raw and filtered)
The script includes a standalone fit_drift_from_df() helper that operates
directly on a DataFrame rather than an EchoExtractor object — useful when
comparing pre- and post-filter echo sets without re-extracting:
df_vel_raw  = fit_drift_from_df(df_raw,  height_bin_km=50.0)
df_vel_filt = fit_drift_from_df(df_filt, height_bin_km=50.0)
fit_drift_from_df() parameters:
| Parameter | Default | Description |
|---|---|---|
height_bin_km |
50.0 |
Bin width (km) |
min_echoes |
6 |
Minimum echoes required per bin |
snr_weight |
True |
SNR-weighted least-squares |
n_sigma |
2.5 |
Sigma-clipping threshold |
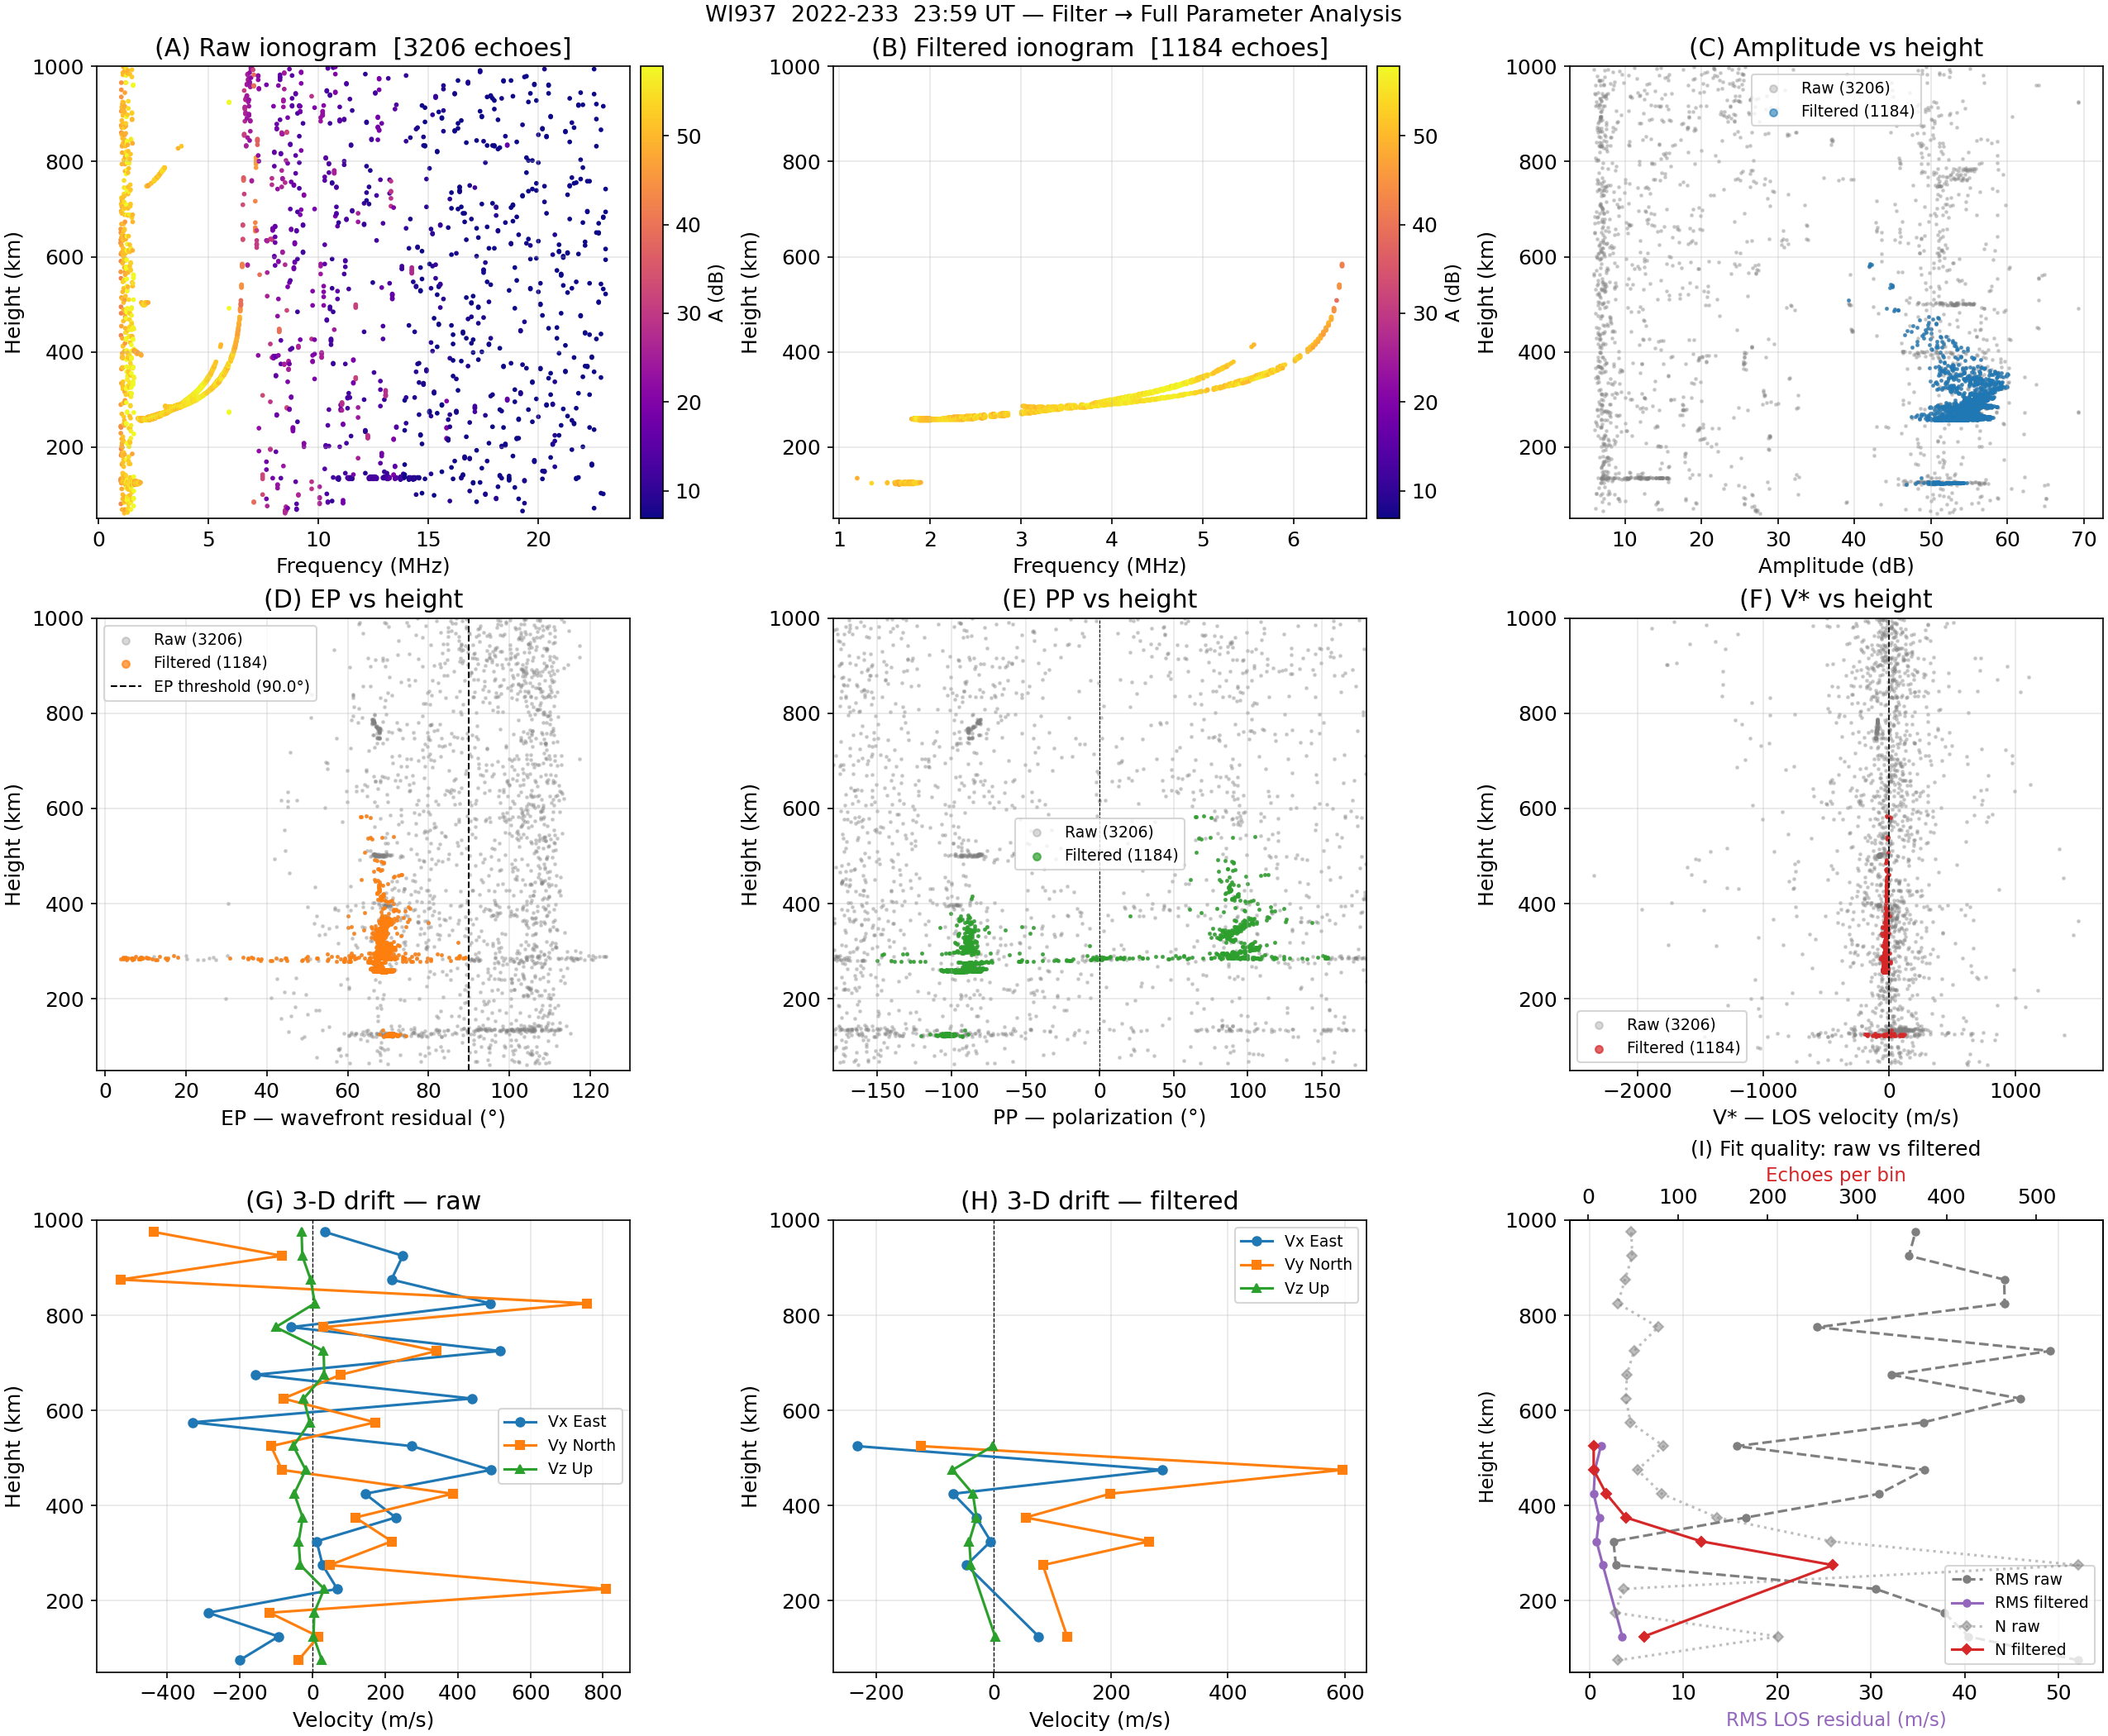
4 — Output figure (3×3)
Saved to docs/examples/figures/ionogram_full_analysis_wi937.png:
| Panel | Contents |
|---|---|
| (A) Raw ionogram | Frequency vs height, amplitude colourmap |
| (B) Filtered ionogram | Same axes after noise rejection |
| (C) Amplitude vs height | Grey = raw, blue = filtered |
| (D) EP vs height | Grey = raw, orange = filtered; dashed vertical at EP threshold |
| (E) PP (polarization) vs height | Grey = raw, green = filtered |
| (F) V* (LOS velocity) vs height | Grey = raw, red = filtered |
| (G) Vx/Vy/Vz vs height — raw | Three-component drift from unfiltered echoes |
| (H) Vx/Vy/Vz vs height — filtered | Three-component drift from filtered echoes |
| (I) Fit quality: raw vs filtered | RMS LOS residual and echo count per bin, dual x-axes |
Run
Key observations
- Panels A vs B: the filtered ionogram retains the coherent F-layer trace while removing diffuse scatter above the MUF and low-height clutter.
- Panels D (EP): the EP filter (
ep_max_deg=90°) removes only strongly non-planar returns; most oblique echoes (EP 50–80°) are preserved. - Panels G vs H: filtering tightens the height-resolved drift estimates — the RMS LOS residual (panel I) drops substantially in height ranges dominated by multi-hop or RFI contamination.
Related
- Ionogram Filter — detailed description of all six stages
- Drift Velocity — WI937 — dedicated drift-only workflow
- Echo Extraction — WI937
pynasonde/vipir/riq/parsers/filter.py—IonogramFilterpynasonde/vipir/riq/echo.py—EchoExtractor